The Energy of Natural Disasters
Tornadoes
For their size, tornadoes possess more concentrated power than any other force in nature. The average tornado is usually around just a tenth of a mile wide, but has an output of 10,000 kilowatt hours of energy. This makes it a potent destructive force, capable of leveling houses, uprooting trees, and leaving a trail of general destruction in its wake. To put this into perspective with human energy consumption, the energy in one three- to five-minute tornado could light 1,000 100-Watt light bulbs for over four days straight. Make those light bulbs compact fluorescent and they’ll last a week.
Power of an Average Tornado:
• The equivalent of 6 barrels of oil
• The max capacity of a typical backyard generator
• Over 10 months’ electrical consumption for a single household
• 300 gallons of jet fuel
Volcanoes
The intense heat, earth-shaking force, and explosive violence of volcanoes make them spectacular to behold and dangerous to be near. The famous Mt. St. Helen eruption, which killed 57 people in Washington State on May 18, 1980, released 24 megatons of explosive power when it erupted. This is more energy than 720 Nagasaki atomic bombs. If it could somehow be harnessed, that amount of energy could power the entire nation of Zimbabwe for two and a half years. There have been no attempts to harvest the power of a volcanic eruption; however mankind has begun tapping into the source that powers them: super hot magma beneath the earth’s crust. Iceland leads the world in geothermal energy production, but the 7,000 megawatts produced by geothermal globally each year looks like a birthday candle when compared to the power of a volcano.
Power of a Volcano (Mt. St. Helen):
• The explosive force of 4,000,000,000 sticks of dynamite*
• More than the combined energy produced by all nuclear power plants in the U.S. each year
• Enough energy to power the Large Hadron Collider for over 10,000 days
*A stick of dynamite is 1/2 pound of TNT. A ton of TNT is 4,000 sticks. A megaton is one million tons.
Earthquakes
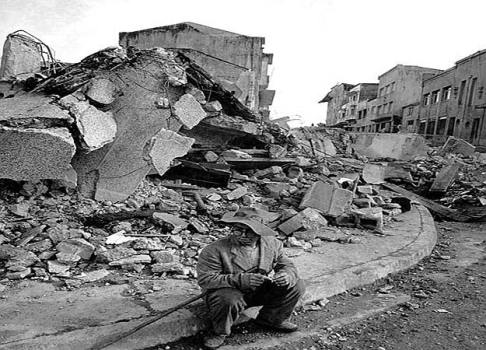
The power of an earthquake is virtually unlimited, but seismologists have developed a number of scales to measure their strength, the most commonly used being the Richter scale. The quake that rocked Haiti in January 2010 measured 7.1 on the scale, classifying it as a major earthquake. There are about 18 such earthquakes recorded each year, and all have a measurable impact of at least 44.7 megatons of power. This is equivalent to the payload of the Czar Bomba, the most powerful nuclear weapon ever developed. This much energy could meet the energy needs of Norway for one full year. The most powerful earthquake ever recorded, the Valdivia Earthquake in Chile (1960) measured a 9.5 on the Richter scale and released 178 gigatons of force, enough energy to power the world for almost an entire year.
Power of the Haiti Earthquake:
• The energy equivalent of burning 100,000,000 barrels of oil
• The amount of energy needed to fly a jumbo jet around the earth over 300 times
Hurricanes
The most powerful expression of nature’s wrath on earth is the hurricane. These massive weather events release incredible energy and can last for days. Each day, an average hurricane releases 1.3 x 10¹⁷ Joules of wind energy, the equivalent of more than half of all the energy being produced by humans on earth. But this is almost nothing compared to the amount of power it takes to keep a hurricane going. Between cloud formation and rain output, a typical hurricane utilizes 5.2 x 10¹⁹ Joules/day, enough energy to meet all of the earth’s needs 200 times over. This makes the hurricane by far the world’s most energetic natural event. While harnessing the full power of a hurricane is virtually impossible, we are able to harness wind energy, generating 159 gigawats of power each year, or about 2% of the world’s total. [9]
Power of an Average Hurricane:
• The force of over 100 Czar Bombas [8]
• Enough energy to power the U.S. for five years [4]
• More than 10,000 times the capacity of all wind turbines on earth [10]
Tsunamis
Any giant wave can be classified as a tsunami, whether caused by an earthquake, volcano, or underwater explosion (such as a nuclear test). The amount of energy in a tsunami varies greatly by both the cause of the wave and the intensity of that event, but the amount of energy is always immense. In 2004, an extremely violent tsunami originating in the Indian Ocean decimated nearby coastal countries like Sri Lanka in one of the deadliest natural disasters in modern history. The event was triggered by a magnitude 9.1 earthquake, the second strongest on record. The amount of force expended to create the deadly waves of that tsunami could have powered the United States for an entire year, but that’s just a fraction of the earthquake’s energy. The total amount of work done, most of which took place underground, would power the United States for a whopping 370 years. If all of this energy had been transferred into the giant wave, there’s no telling how much devastation would have been done to the region. The more recent tsunami in Japan is also certainly notable, however, energy statistics have not been confirmed at the time this article was written.
Power of the 2004 Indian Ocean Tsunami:
• The force of 1,500 Hiroshima Bombs
• The energy equivalent of burning 248,000 tons of jet fuel [4]
Solar Flares
Almost all energy and potential energy on earth is derived from the sun. Each second, the sun releases more power than humans could ever hope to use, but sometimes a little extra energy is released in an event known as a solar flare. Solar flares affect all levels of the earth’s atmosphere, and the radiation they produce can wreak havoc on electronic communications and other human activities. Without the protection of the atmosphere, the proton storms generated by these flares would be deadly to anyone who encountered them. The amount of energy released in a solar flare can be as high as 6 x 1025 Joules of energy, more than all the fossil fuels that exist on earth, and have ever existed on earth, combined. [11]
Power of a Solar Flare:
• 1,000x more than all the coal in the world
• 1,000x more than all the uranium in the world
• 10,000x more than all the oil in the world
• 10,000x more than all the natural gas in the world
• Enough to power all of the earth for 500,000,000 years [4]
Read more : http://www.digitalbusstop.com/the-energy-of-natural-disasters/

